How to React & Respond to Cloud Outages You've Never Seen Before: A Senior Engineer's Mental Model
A battle-tested troubleshooting framework for handling zero-day cloud bugs, silent network drops, and distributed system failures: maintaining calm, isolating blast radius, prioritizing mitigation over root cause, and conducting blameless post-mortems.
Study Progress
Mark this module as reviewed for your cloud exam/team prep
The 2:00 AM PagerDuty Nightmare
Every cloud and backend engineer remembers that sinking feeling: the monitoring channel floods with alerts, API error rates spike to 100%, and the symptoms make zero sense.
It isn't a simple disk-full error. It isn't a typo in a config file. It is an esoteric, distributed system failure you have never encountered in your career.
When facing a completely novel incident, your immediate human reaction—panic, rushed guessing, or shotgun-restarting random production servers—is the single most dangerous failure multiplier.
Here is the structured mental model and step-by-step incident response framework I use to navigate complex, unknown cloud failures with precision and calm.
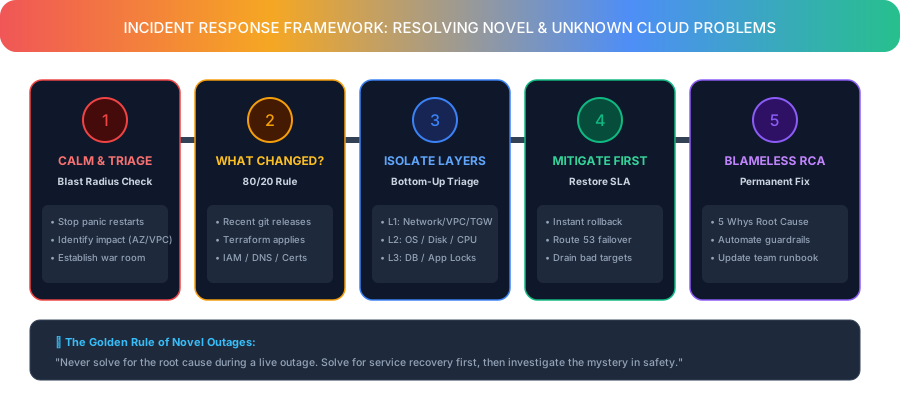 Figure 1 — The 5-stage framework for triaging and resolving novel cloud outages.
1. The Mindset: First Rule of Holes
"If you find yourself in a hole, stop digging."
During an unprecedented outage, engineers often feel pressured to act immediately. They push random hotfixes, restart master databases, or tweak AWS security groups blindly. This almost always wipes out ephemeral log trails, corrupts in-flight transactions, or creates a secondary cascading outage.
The Golden Rule:
Separate Service Mitigation from Root Cause Investigation.
- During the live outage: Your ONLY job is to restore customer traffic and bring error rates down (via rollbacks, failover, traffic draining, or rate limiting).
- After the site is healthy: You have all the time in the world to reproduce the bug in staging and conduct deep root-cause forensics in safety.
2. The 5-Step Response Framework
Step 1: Calm, Triage & Determine the Blast Radius
Before touching the terminal, answer three fundamental scoping questions:
- Who is affected? Is it 100% of global traffic, or only users in a specific AWS Region (e.g.
ap-south-1) or tenant? - What is failing? Is data actively being corrupted (immediate stop required), or are requests timing out (504 Gateway Timeout)?
- Establish a Single Incident Commander: In remote teams, designate one person to lead the triage war room while others investigate specific subsystems to avoid stepping on each other's toes.
Step 2: The "What Changed?" Vector (The 80/20 Rule)
More than 80% of novel cloud outages stem directly from a recent change.
Before suspecting an AWS physical datacenter outage or complex kernel race condition, methodically audit what happened in the last 60 minutes:
- 🚀 Recent Git Deployments: Check recent merge commits across all microservices.
- 📜 Infrastructure as Code: Was
terraform applyrun recently on VPC route tables, Transit Gateway attachments, or IAM roles? - 🔑 Credentials & Secrets: Did an SSL certificate expire, or was an API key rotated?
- 🌐 External Dependencies: Did a third-party upstream gateway (Stripe, Twilio, Auth0) degrade?
- ⏰ Scheduled Cron Jobs: Did a heavy batch export lock a primary database table at the top of the hour?
Step 3: Layered Bottom-Up Isolation
When the cause remains completely mysterious, systematically isolate each layer of the cloud stack from the bottom up:
[Layer 5: Application Code]  --> Memory leaks, unhandled exceptions, deadlock
[Layer 4: Database / Cache]  --> Connection pool exhaustion, lock contention, slow queries
[Layer 3: OS & Compute]      --> CPU throttling, OOM killer, disk IOPS saturation
[Layer 2: Cloud Networking]  --> Transit Gateway routing, MTU black holes, SG rules
[Layer 1: DNS & Ingress]     --> Route 53 TTL, ALB health checks, TLS handshake
Diagnostic Commands Cheat Sheet:
# 1. Check Network Connectivity & MTU Packet Path
ping -c 4 -M do -s 1472 10.30.1.100
traceroute -n 10.30.1.100

# 2. Check Port Listening & Open Sockets on Linux Node
ss -tulwn | grep :80
netstat -s | grep -i "listen overflows"

# 3. Check Kernel OOM (Out of Memory) Kills & Hardware Errors
dmesg -T | grep -iE "oom|out of memory|killed process"

# 4. Check PostgreSQL / Database Active Queries and Locks
SELECT pid, age(clock_timestamp(), query_start), usename, state, query
FROM pg_stat_activity
WHERE state != 'idle' ORDER BY age(clock_timestamp(), query_start) DESC LIMIT 10;
Step 4: Mitigate First (The Eject Buttons)
If you cannot immediately diagnose the novel bug within 5–10 minutes, activate your predefined recovery patterns:
- Instant Rollback: Revert to the last known healthy container image or Git commit hash.
- Multi-AZ / Multi-Region Failover: In Route 53 or your Load Balancer, route traffic away from the degraded Availability Zone or compute pool.
- Graceful Degradation / Circuit Breakers: Enable read-only mode, serve stale cached responses from Redis/CloudFront, or disable non-critical background telemetry workers.
Step 5: The Blameless Post-Mortem & 5 Whys
Once the system is restored to green status, schedule a blameless post-mortem within 48 hours:
- Timeline Reconstruction: Document exact timestamps (Alert triggered $\rightarrow$ War room created $\rightarrow$ Rollback executed $\rightarrow$ Recovery).
- The 5 Whys Root Cause Analysis: Keep asking why until you hit systemic process flaws rather than blaming individual engineers.
- Automated Guardrails: Write automated CloudWatch alarms, Terraform validation rules, or integration tests so this specific issue can never recur silently.
3. Real-World Case Study: The "Silent MTU Black Hole"
The Mysterious Symptom:
After launching a new microservice in a multi-VPC Transit Gateway architecture, small HTTP requests (GET /health) succeeded instantly (100% pass), but large payload requests (POST /api/v1/telemetry-upload with 50KB JSON bodies) hung indefinitely and timed out with 504 Gateway Timeout.
The Investigation:
- Initial Guess: Application bug or memory leak? (Checked logs: no exceptions, CPU at 5%).
- Network Layer Check: Small ICMP packets (
ping 10.30.1.100) succeeded with 0.8ms latency. - The Breakthrough: Tested ping with maximum non-fragmented packet size:
ping -c 4 -M do -s 1472 10.30.1.100 # FAILED with "Message too long" - Root Cause: One VPC spoke had Jumbo Frames enabled (MTU 9001), while an intermediate Transit Gateway attachment path was constrained to standard Ethernet (MTU 1500). Because Path MTU Discovery (PMTUD) ICMP Type 3 Code 4 packets were blocked by a strict Security Group, packets larger than 1500 bytes were silently dropped into a black hole!
- The Fix: Standardized MTU sizes across VPC attachments and allowed ICMP fragmentation messages in Security Groups.
Summary Checklist for Unknown Outages
| Phase | Immediate Action | Anti-Pattern to Avoid |
|---|---|---|
| 0 - 5 min | Triage blast radius, establish incident commander | Panicking, guessing, mass restarts |
| 5 - 15 min | Check recent git/Terraform changes, audit logs | Diving into deep code weeds |
| 15 - 30 min | Execute rollback, failover AZ, or drain bad nodes | Refusing to rollback without root cause |
| Post-Outage | Conduct blameless 5-Whys, automate runbooks | Blaming people, skipping documentation |
🚀 Want to master high-availability cloud architecture?
Explore my hands-on guides on AWS VPC Transit Gateway Hub-and-Spoke Topology and Amazon Lightsail Dual-Node Load Balancing.
Related Tags

Akhil Jayaraj
AWS Cloud & DevOps Engineer
Architecting resilient multi-VPC AWS networks, Kubernetes infrastructure, and high-scale SaaS backends.
View About Me